- 1.What are restaurant data analytics?
- 2.The benefits of restaurant analytics
- 3.How to use restaurant analytics to increase revenue
- Dashboard
- Sales Trends and Summary
- Items
- Categories
- Website funnel
- Clients
- Table Reservation
- Google ranking
- Website visits
- Delivery Heatmaps
- Connectivity health
- Orders
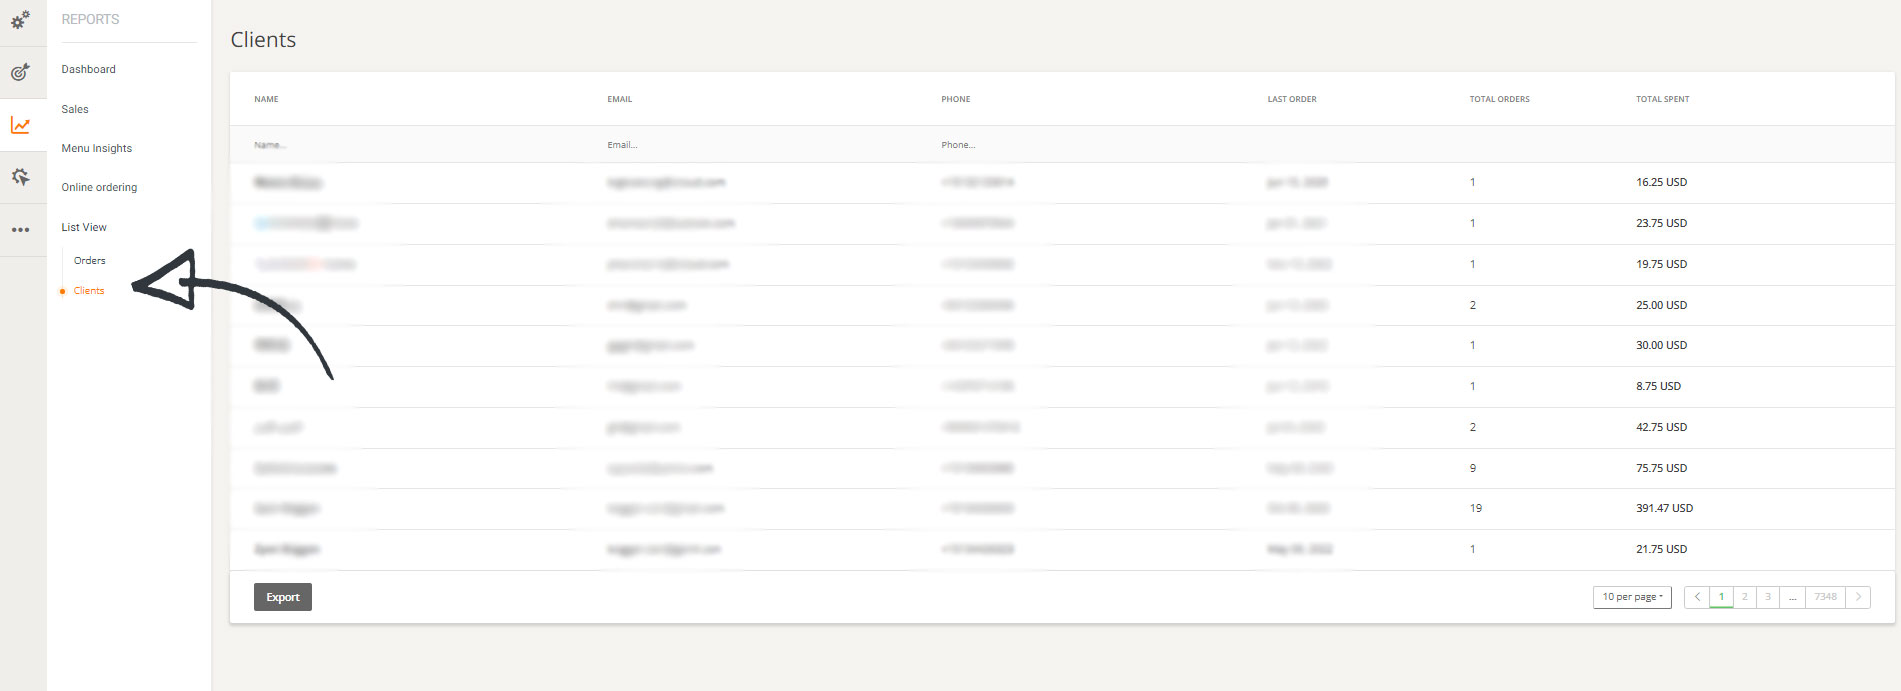
- Clients
- 4.Conclusion
In today’s seemingly vast number of restaurant software systems available on the market, it is pretty challenging to find one that suits all your needs without putting a strain on your pocket.
The ideal restaurant software should allow you to take orders and provide you with the best restaurant analytics that will help you streamline your operations and increase profits.
What are restaurant data analytics?
Simply put, restaurant data analytics contains raw and aggregated data collected and presented to restaurant owners to aid them in making better decisions.
This data is presented in graphs, charts, lists, and other easy-to-read visualizations. Restaurant managers sometimes downplay the importance of data science in the restaurant industry without realizing how powerful this tool could be in their restaurant’s profitability.
Today’s article will take a deep dive into all the restaurant performance metrics available in our free restaurant analytics software and how you can use these statistics to cut costs and increase your revenue.
The benefits of restaurant analytics
Like any other business, continuous and in-depth analysis of your restaurant’s statistical data is vital for its success. By continually reviewing your restaurant data, you can instantly spot downward trends and devise strategies to combat them.
Likewise, you can become conscious of opportunities you might have missed if you were not using analytics.
Restaurant analytics can help you upgrade your menu by identifying your top-performing items and those that do not sell as much. You can then choose to remove the lesser performing items from the menu or offer them at a lower price to entice your customers to order more.
How to use restaurant analytics to increase revenue
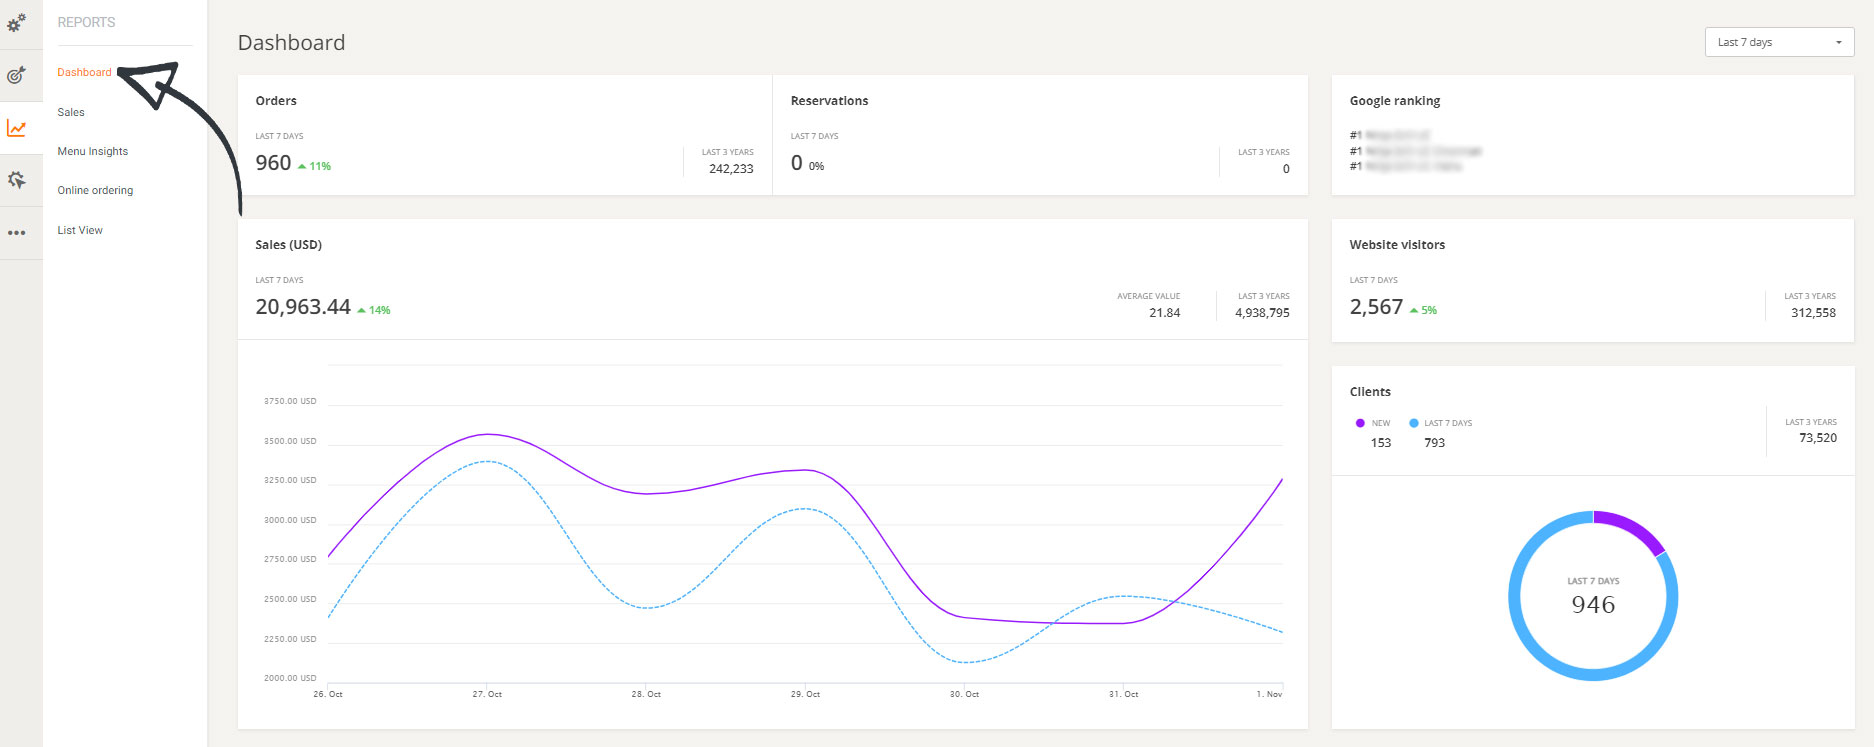
To access the reporting module in our free online ordering system, go to Reports ⟶ Dashboard.
Dashboard
The dashboard section of your restaurant admin panel is where you can find general information about your restaurant. This section includes at a glance:
- The number of accepted orders/reservations
- The value of orders/reservations
- Your website rank in Google
- The number of website visitors
- The number of new clients vs. your total number of clients
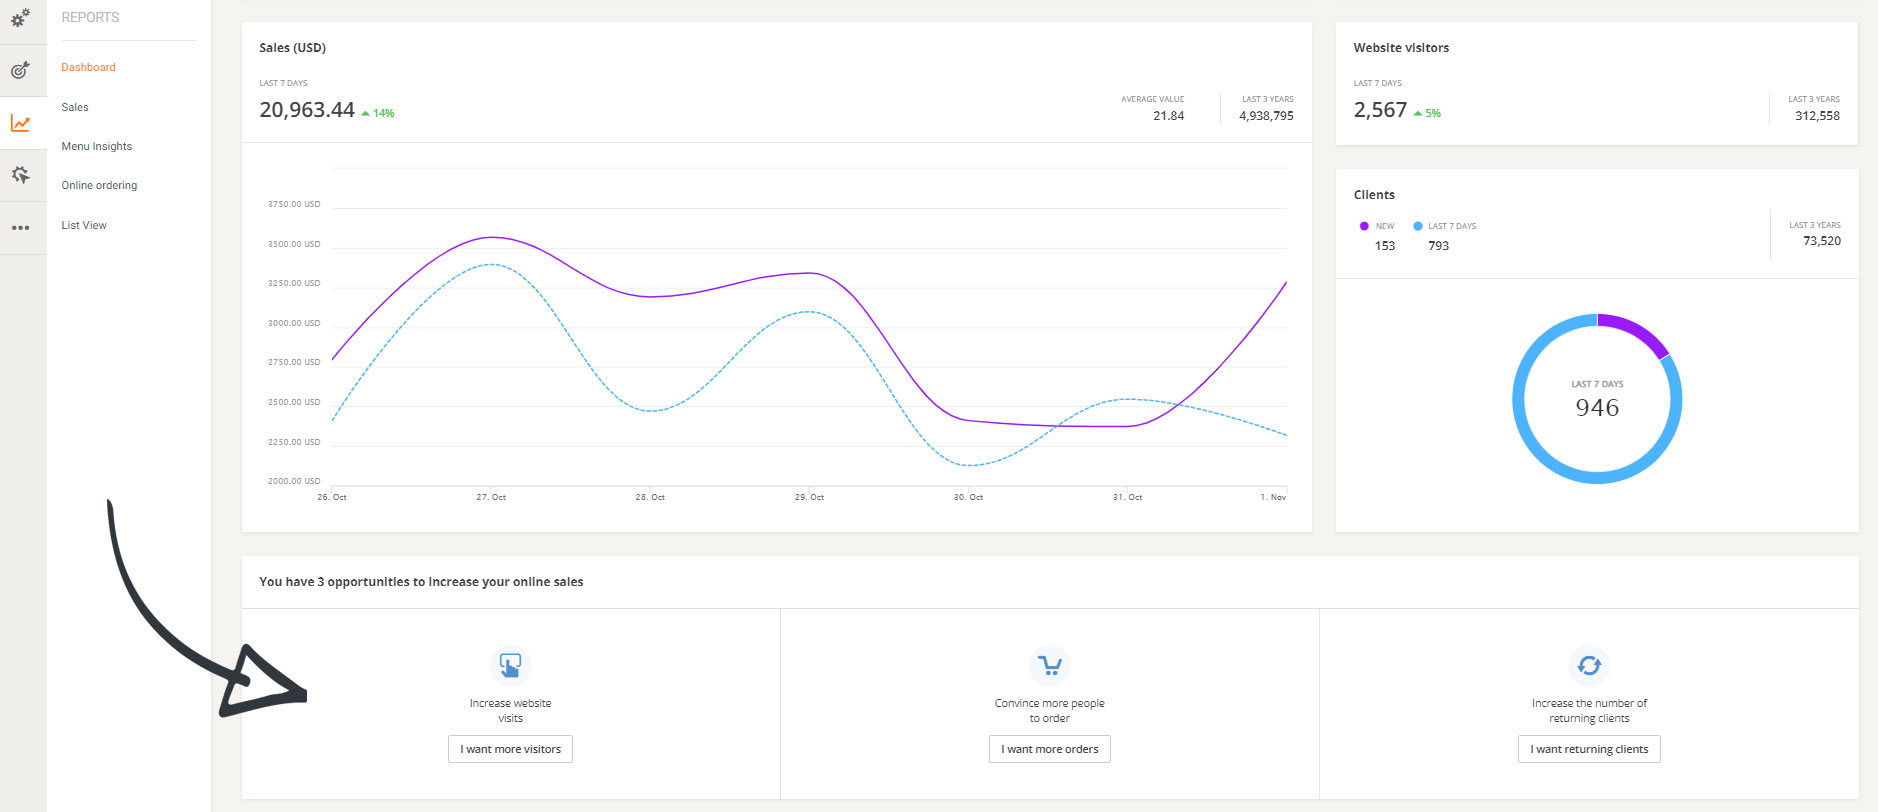
At the bottom of the page, there is also a section on steps to increase online sales.
In case your restaurant is not getting as many visitors as you expected, here are a few steps you can take that may boost the number of visits:
- Make it easy for clients to find your website on Google by adding SEO to properties. I would propose hiring a professional to help you with that, or you can get a Sales Optimized Website from us that has the SEO properties built-in.
- Make your restaurant stand out in your local area with a Google Business listing. Google Business Listings are a fantastic way to get your business noticed; they display the name, location, and opening hours of the company right in the results of a search.
- Use your Facebook business page to show off your menu and drive website visits. Add your website URL in the info section of your Facebook business page to direct your clients to your website, or you can integrate the “order food” button with our food ordering system.
Sales Trends & Summary
From this report, you can derive the Total revenue, Net sales, Orders, and Average order value for a restaurant over a predefined or custom interval. This report can further be tweaked to display the data by order type.
With this report, you can dissect your orders. The data from the report can be used to determine what time of day is the busiest and what order type is more frequent. You can then cross-reference that information to schedule your staff accordingly.
Categories
Similar to the Items report, this report details the performance of menu categories. It contains the same quantitative data as the report above but at a category level.
Items
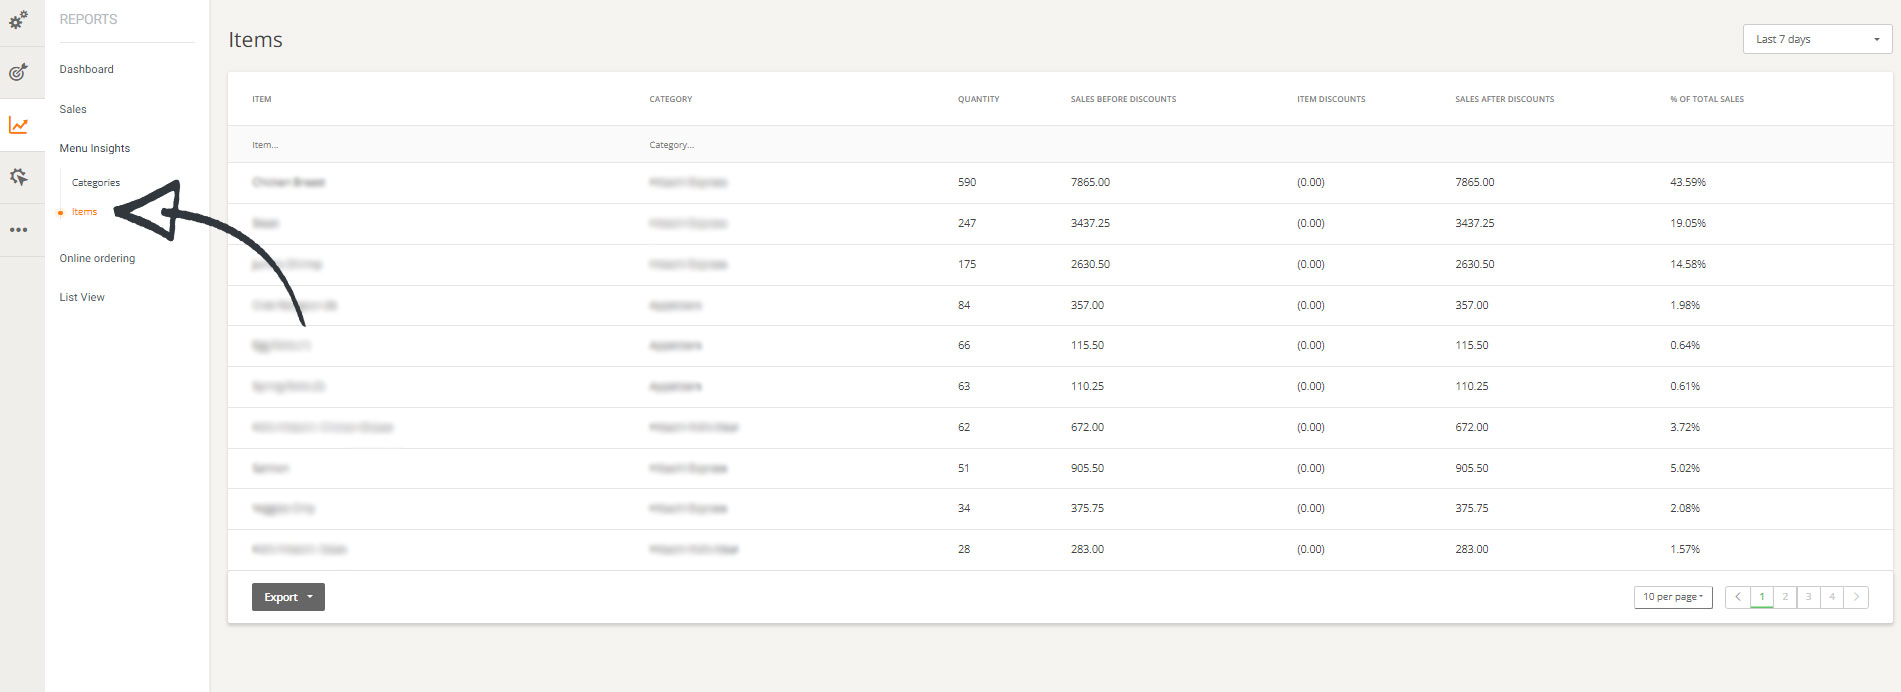
In this report, restaurant owners can find a breakdown on the performance of their menu items. The report lists in a tabular format the menu item, the category to which the menu item belongs, and other numerical data such as:-
- Quantity of the item that has been sold.
- Sales before discounts
- Item discounts
- Sales after discounts
- % of total sales
This report helps in identifying underperforming items so that necessary steps can be taken to boost the item’s performance, like applying promotions to such item or removing it from the menu altogether.
Website funnel
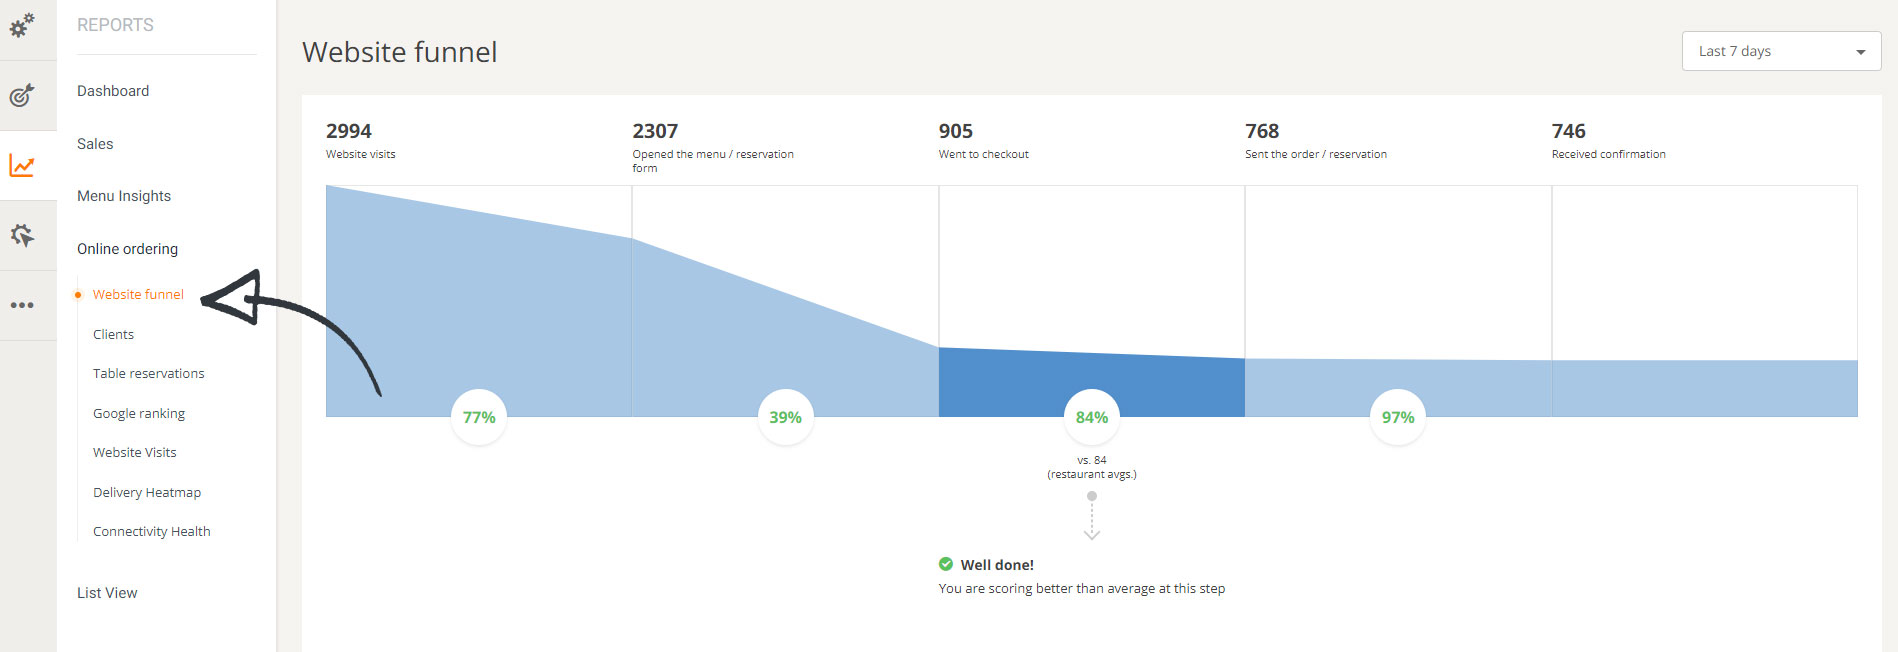
This report tracks the total number of website visitors and their progression to placing an order. You can see where you are losing potential customers and take steps to fix that.
- Website visits – Tracks the number of users that visited your website.
- Opened the menu/reservation form – is the number of visitors that accessed the menu through the order taking button.
- Went to checkout – is the number of clients that placed items in the cart and accessed the checkout form.
- Sent the order/reservation – states how many users placed the order.
- Received confirmation – This is the number of orders that were accepted in the order-taking app.
Having a good quality website is essential for keeping your clients engaged and increases your visitor-to-order conversion rate. If you do not have a sales converting website, you can implement the strategies below to increase the number of orders you receive.
- Ensure that your title tag contains the restaurant name.
- Add your restaurant’s name and city in the meta description of your website.
- The first H1 should contain the restaurant’s name.
- Include your city in the first H1 or the first H2 tags on the page.
- Add a photo gallery to the homepage.
- Ensure the ordering button is on your homepage and in a prominent area, like the navigation bar.
- Add the ordering button to all the secondary pages on the website.
Clients
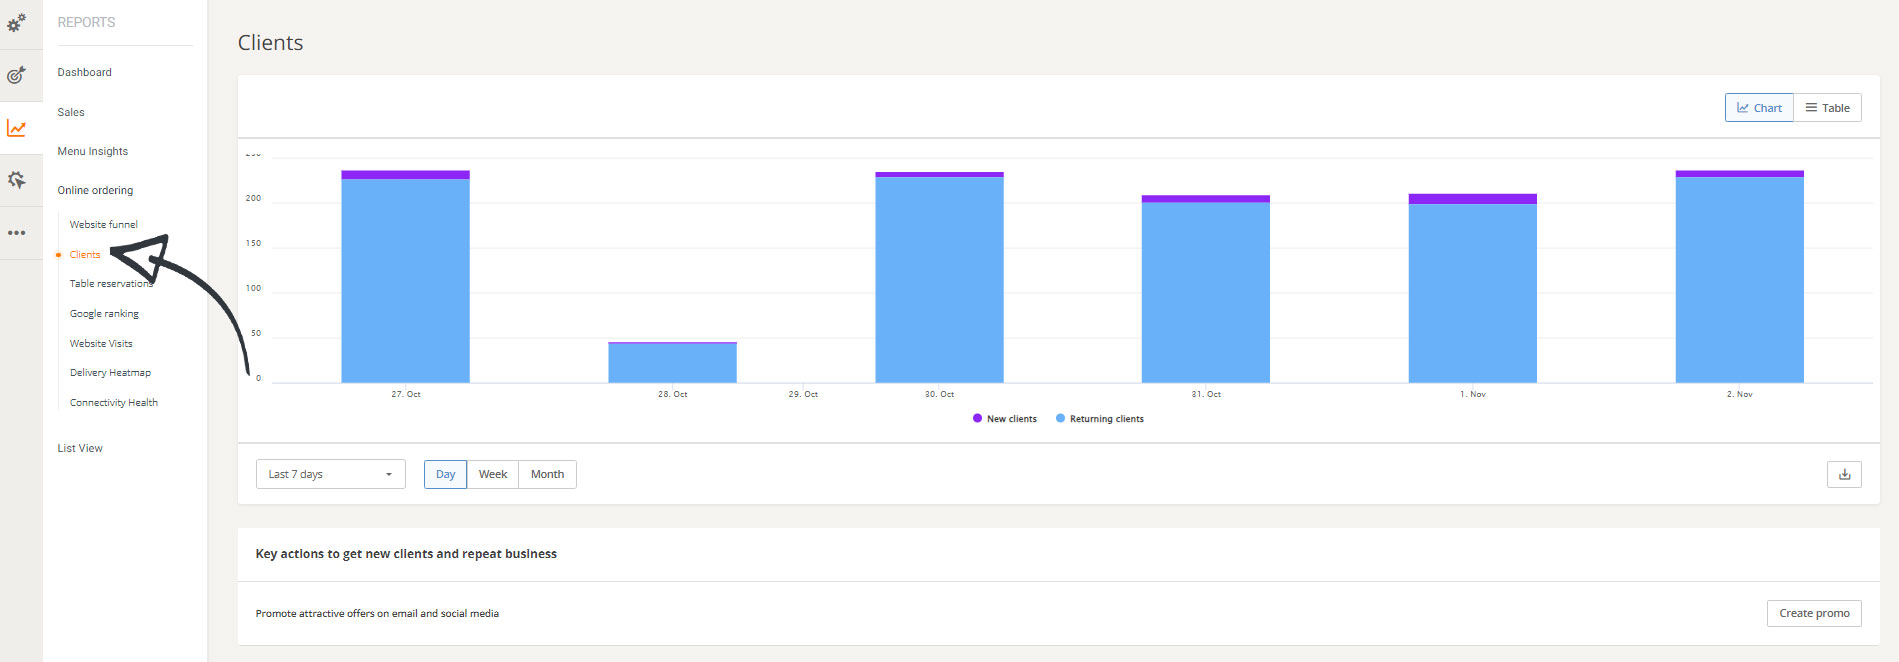
The client section displays the number of returning clients vs. new clients; this can be a great asset when creating promotions. You might want to build campaigns to lure new clients or create a loyalty promotion to reward your returning clients.
Table Reservation
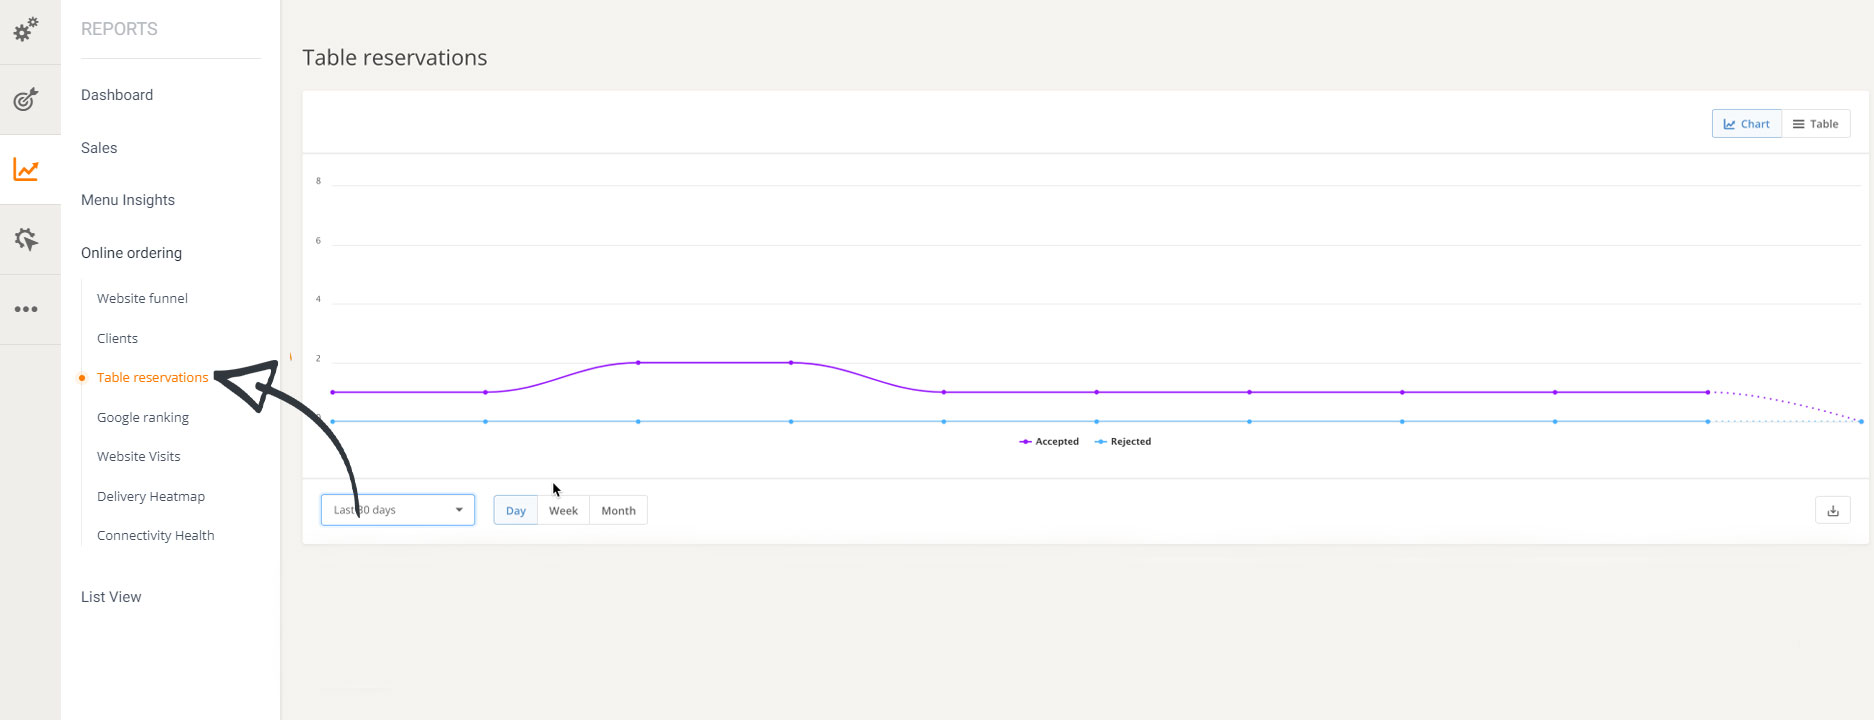
This report displays the number of accepted and rejected reports for a specified period.
Google ranking
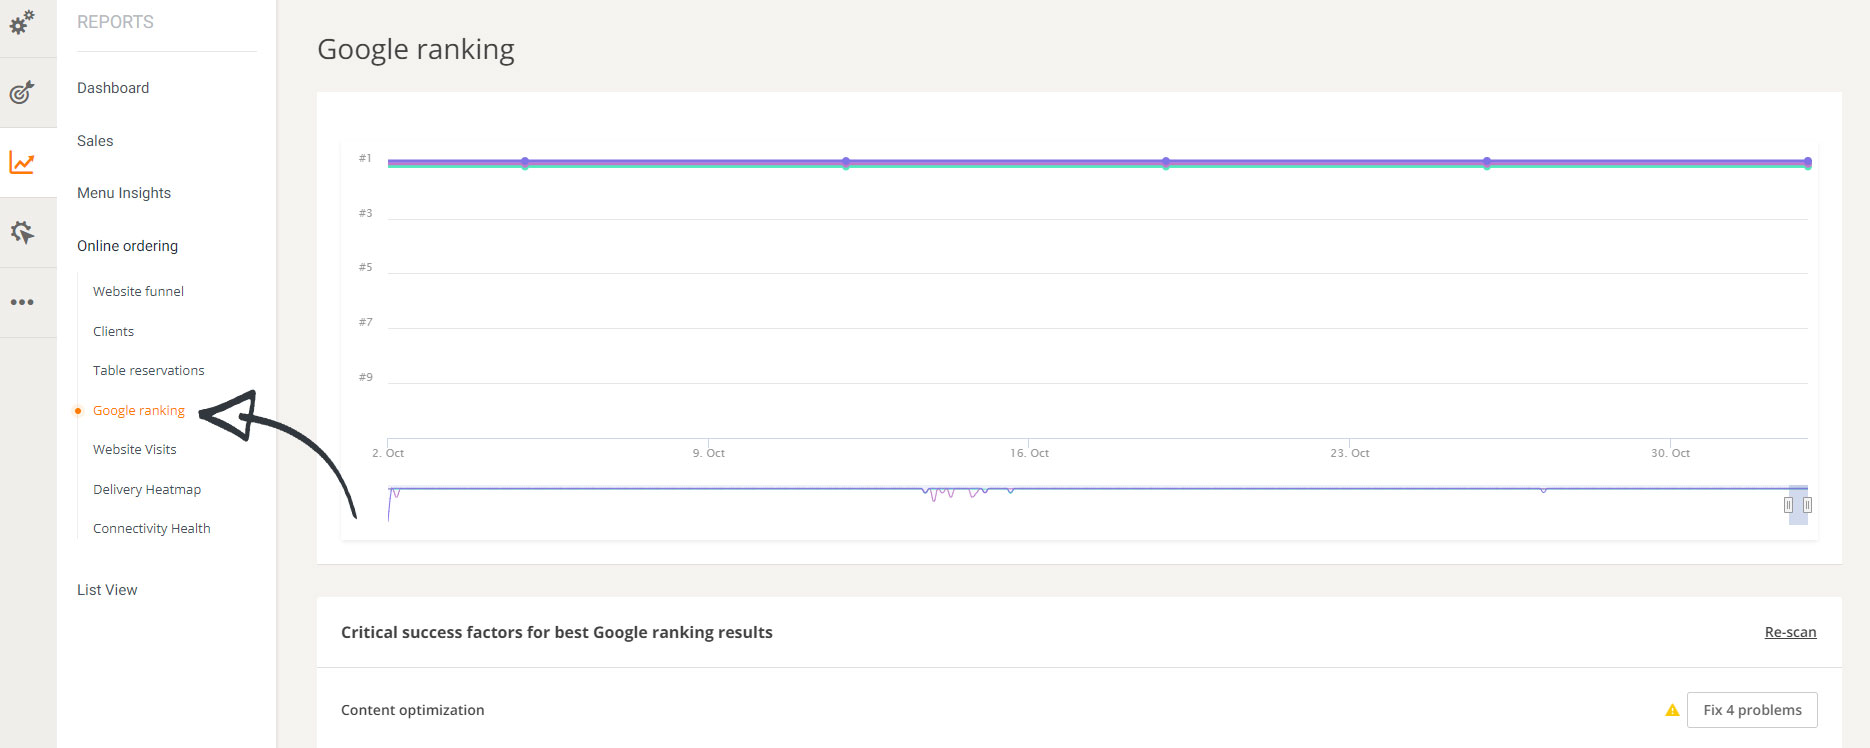
Perhaps one of the most critical aspects of a restaurant’s website is its ranking on Google. Google ranks websites based on several factors. Search engine optimization (SEO) helps websites attain higher positions in Google.
The Google ranking report in our restaurant analytics software displays the ranking of important keywords and specific steps that you need to take to improve your website ranking. Fortunately for you, we have done all the heavy lifting in the Sales Optimized Website that we provide.
Here is how you can increase your ranking in Google:
- Increase your page speed – You can use PageSpeed Insights to test the speed of your website; in case the speed is low, you can try to minify your code or hire a professional developer to assist you with that.
- Ensure your domain name is a real name – Your domain name should be a real first-level domain name. Websites that are hosted on subdomains do not rank well in Google. You should also avoid using the free domain names provided by various website builder software.
- Add an SSL certificate to your website – Search engines take no chances when it comes to the security of your website. It is impossible to have a high rank in Google without securing the data of your users.
Website visits
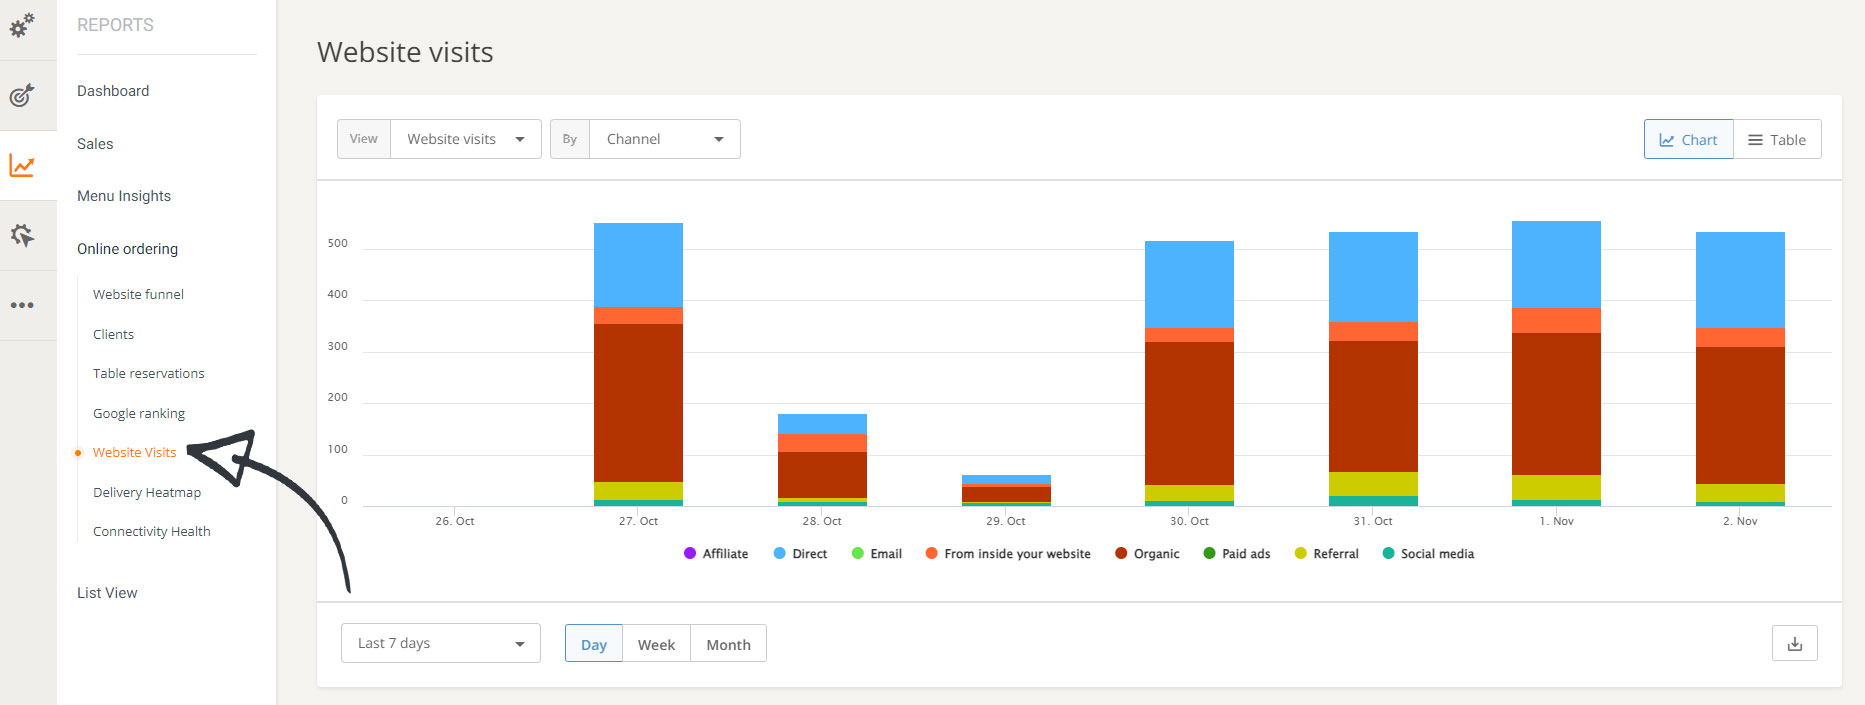
Finding out what channels your website visitors use to access your website helps you refocus your marketing campaigns. You might be spending money on specific media that do not drive visitors to your website. This report details the exact channels used by your visitors to access your website.
One way you can increase website visitors is by promoting attractive offers on email and social media. Our food ordering system has a feature that allows you to set your promotions on autopilot.
This function will send email promotions to encourage your clients to order again once a certain amount of time has passed since they last placed an order from you.
Delivery heatmaps
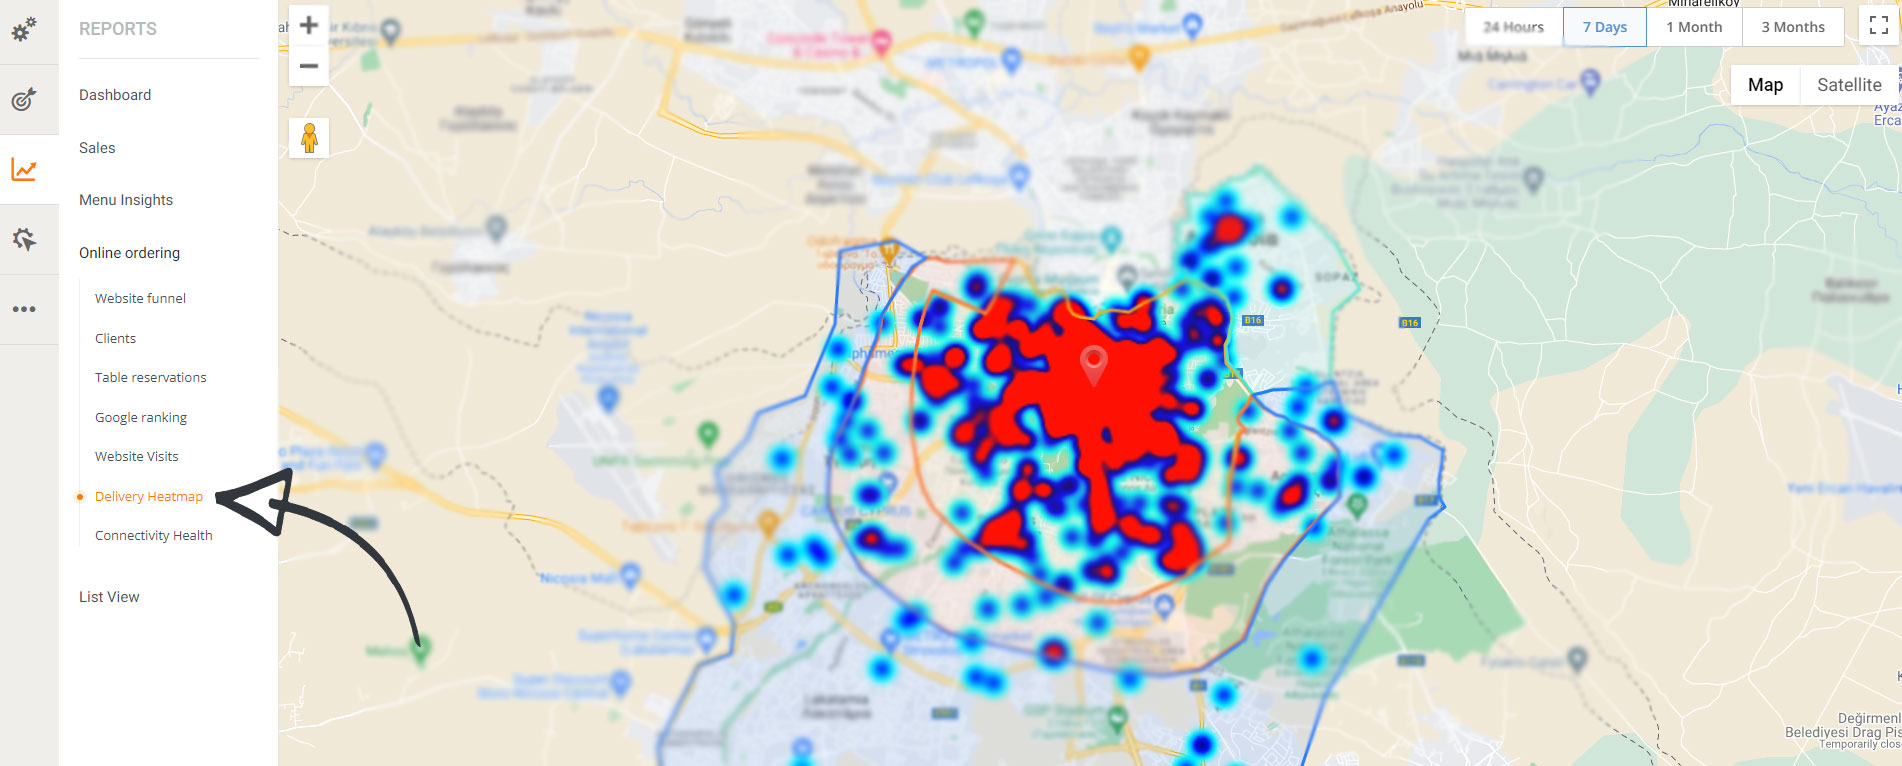
One way to ensure that your delivery fees are effective is by tracking which areas are ordering the most. The delivery heatmaps pinpoint the order density in your delivery zones.
This report can help in setting optimal delivery fees for your zones. You may consider lowering the delivery fees for areas with a low density of orders and monitoring the report to see if it increases in the future.
Connectivity Health
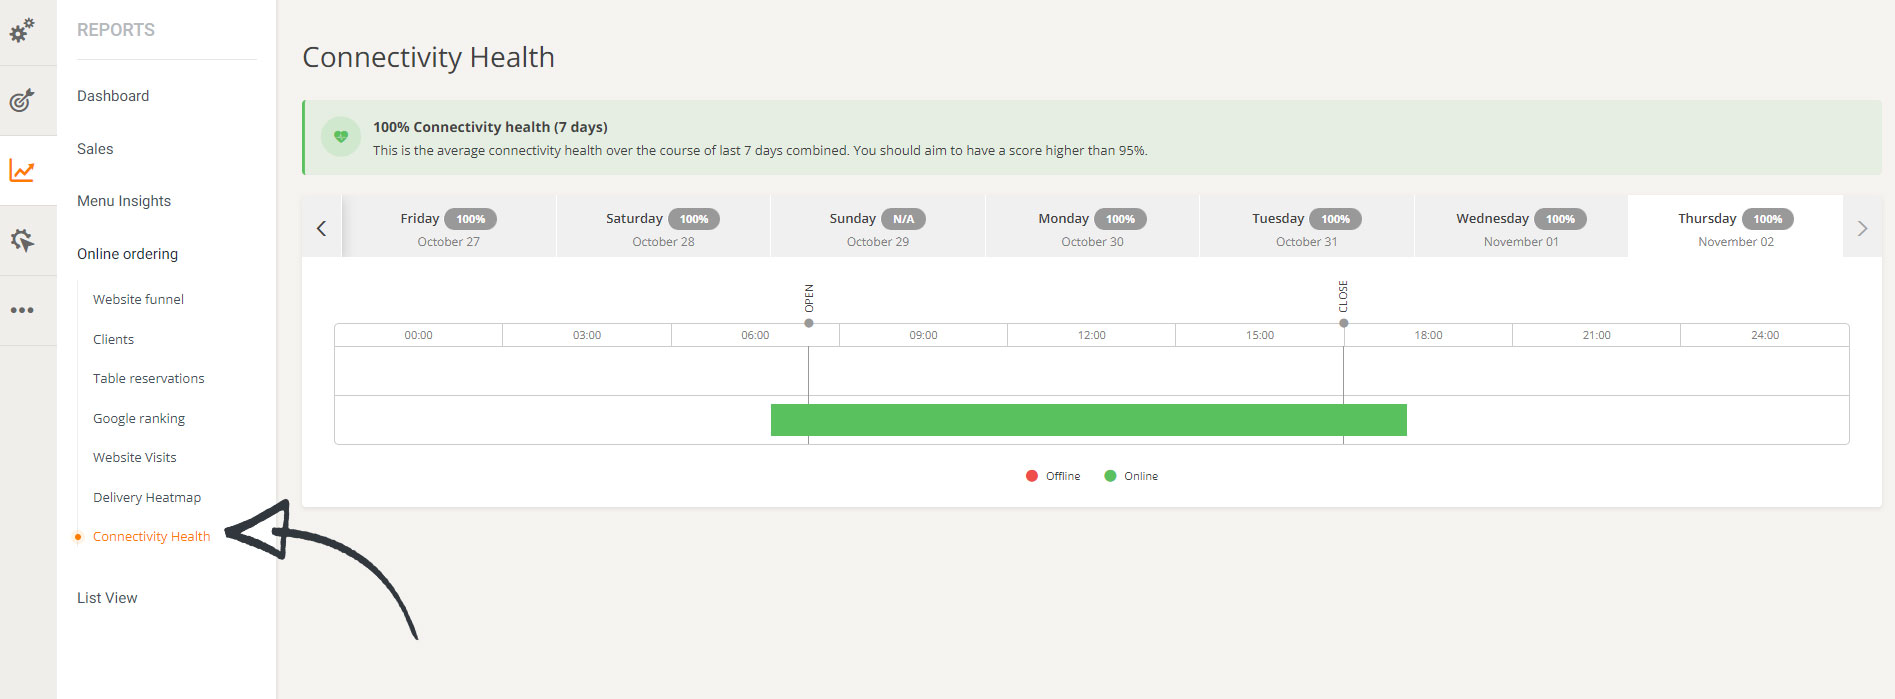
A report that shows the exact times when the order-taking app was online or offline.
Orders
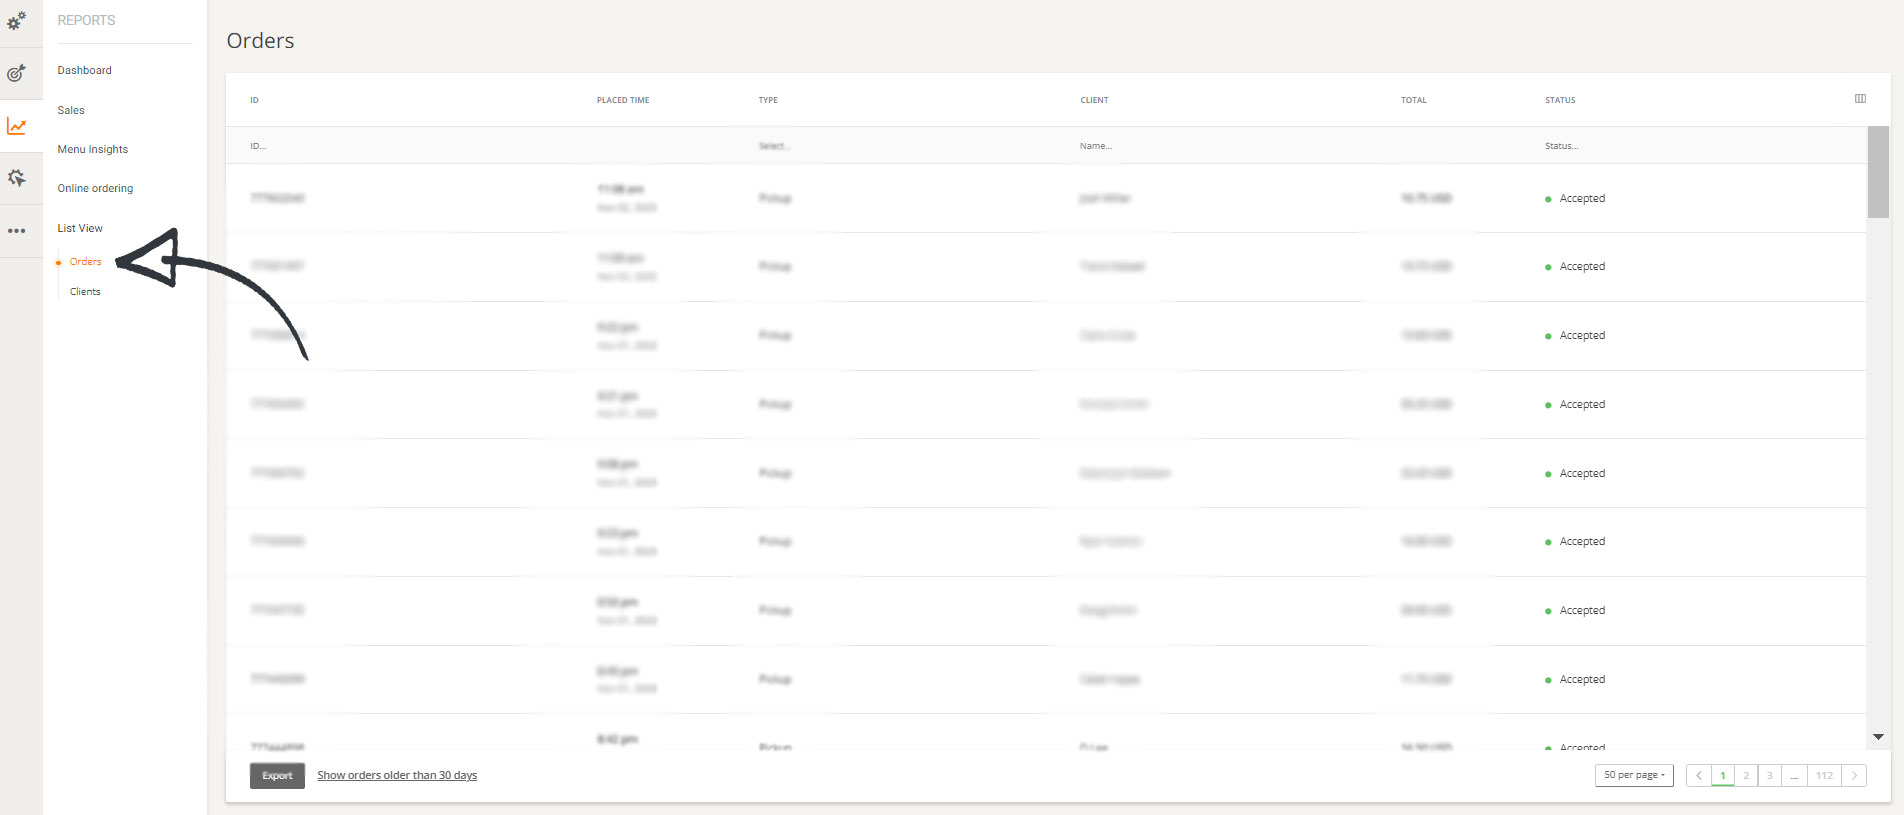
This report presents restaurant customer data and detailed descriptions of every order placed in your restaurant.
Clients
This report lists the information of all your customers such as their names, phone numbers, and email addresses. This client data can be used to launch mailing campaigns per your local laws.
Conclusion
With the increase in digitization of restaurant systems, choosing a tool that provides you with meaningful restaurant analytics is now more critical than ever.
Good food analytics makes for sound decision-making. You don’t need to be a data scientist to analyze your restaurant revenue statistics and run your restaurant at optimal capacity
